GPU profiling for WebGPU workloads on Windows with Chrome
Fast Forward
If you’ve read the article already and/or want to jump straight to profiling, go to the TL;DR section.
Context
WebGPU is not a native graphics API, as in no hardware vendor provides specific drivers for their GPUs targeting this API. Instead, WebGPU runtimes like web browsers must implement backends for WebGPU using modern native APIs such as DirectX12, Vulkan or Metal. Those APIs are widely used, in particular for video games, and hardware vendors have developed great profiling tools for them.
Sadly those GPU profilers don’t work out of the box with WebGPU workloads executed by Chrome. The main reason for this is that while Chrome does execute such workloads using the aformentioned graphics APIs, it doesn’t present the rendered content on screen using those APIs. There are good reasons for this and the technical details are not important here, the point is GPU profilers wouldn’t work and it made me sad.
The good news is I found a way to work around that limitation! It’s a terrible hack but in practice it works well. All you need to do is download a DLL I wrote and put it in the correct location to get both AMD’s Radeon GPU Profiler and Nvidia’s Nsight to work! See the details in the next section. Also, while this only works on Windows I have seen this gist floating around for Apple, but I have nothing for Linux :/.
If you are interested in what was missing, how I fixed it and what this mysterious DLL is doing, please read the following companion blog post Shimming d3d12.dll for fun and profit. I would also like to thank Marco Castorina and Ray Dey without whom this hack probably wouldn’t exist :).
How to use
⚠ Before anything else, please remember that this is a hacky solution and that you should not browse the open web with that DLL attached. It should only be used for a GPU profiling session and removed afterwards. It also conflicts with PIX, so you should remove it before attempting to take a capture. I would recommend adding that DLL to a specific flavor of Chrome ( Dev, Canary, etc. ) that you would only use for GPU profiling.
Getting the DLL
Go to the following repository and either download d3d12.dll from the release section or download the repository and build it yourself. Place the DLL in the Chrome folder where chrome.exe exists, for instance:
C:\Program Files\Google\Chrome\Application
Chrome command line arguments
The way you should launch Chrome depends on the profiler you will be using. However, the command line arguments required are mostly the same as the ones used to capture a frame with PIX as described in Tojiro’s blog.
For reference, here are the arguments I use:
--disable-gpu-sandbox --disable-gpu-watchdog--enable-dawn-features=emit_hlsl_debug_symbols,disable_symbol_renaming--no-sandbox--disable-direct-composition
The first arguments are the minimum required to capture a frame. The second ones are convenience arguments that let you inspect shader source with the original variable names. The third one is required by Nvidia Nsight to function properly, I have no idea why. The last argument used to be required to capture Chrome with PIX so I keep it around just in case.
Enabling debug markers
To enable debug markers, we’ll again refer to Tojiro’s blog. The gist of it is to copy WinPixEventRuntime.dll from https://www.nuget.org/packages/WinPixEventRuntime into <Chrome Dir>\<Version Number>.
Unfortunately, the Radeon tools don’t support PIX markers out of the box. No problem, I wrote a modified version of WinPixEventRuntime.dll that is supported by the Radeon tools. This DLL is hardware vendor agnostic and will only enhance the PIX markers on AMD hardware. The process to get it is exactly the same as getting the modified d3d12.dll. Simply go the following repository and either download WinPixEventRuntime.dll from the release section or clone the repository and build it yourself.
Capturing a frame with RDP
To profile with AMD’s Radeong GPU Profiler, you need to download the Radeon Developer Tool Suite from GPUOpen. Download the package and unzip it at any location you see fit, all the apps are portable.
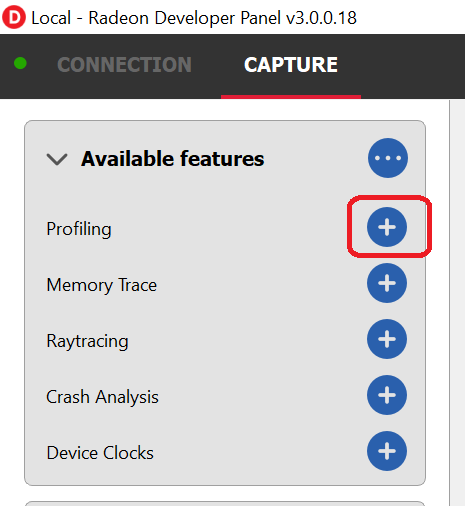
Double-click on the Radeon Developer Panel’s exe to start it. If this is the first time you’re using it, you will likely need to select a feature you would like to use from the top left corner. In our case, we would like to profile the GPU so we will select Profiling.
Please note the green dot on left of the connection tab. If that dot is red, you might need to go to that tab and hit the connect button in the bottom right corner but normally it should connect automatically.
When the Radeon Developer Panel is open, connected and has the Profiling feature selected, any DirectX12, Vulkan, OpenCL or HIP application that you launch from now on will be automatically detected and attached to. This means we are now ready to launch Chrome.
Since RDP doesn’t need to launch the app for you, feel free to open your favorite terminal and to launch Chrome from there using the previously mentioned CLI arguments. The overall command line should look something like this:
"C:\Program Files\Google\Chrome\Application\chrome.exe" --no-sandbox --disable-gpu-sandbox --disable-gpu-watchdog --disable-direct-composition --enable-dawn-features=emit_hlsl_debug_symbols,disable_symbol_renaming
Now open a WebGPU app in a tab and if everything is working properly you should see RDP’s Profiling tab change from Status: Offline to Status: Ready.
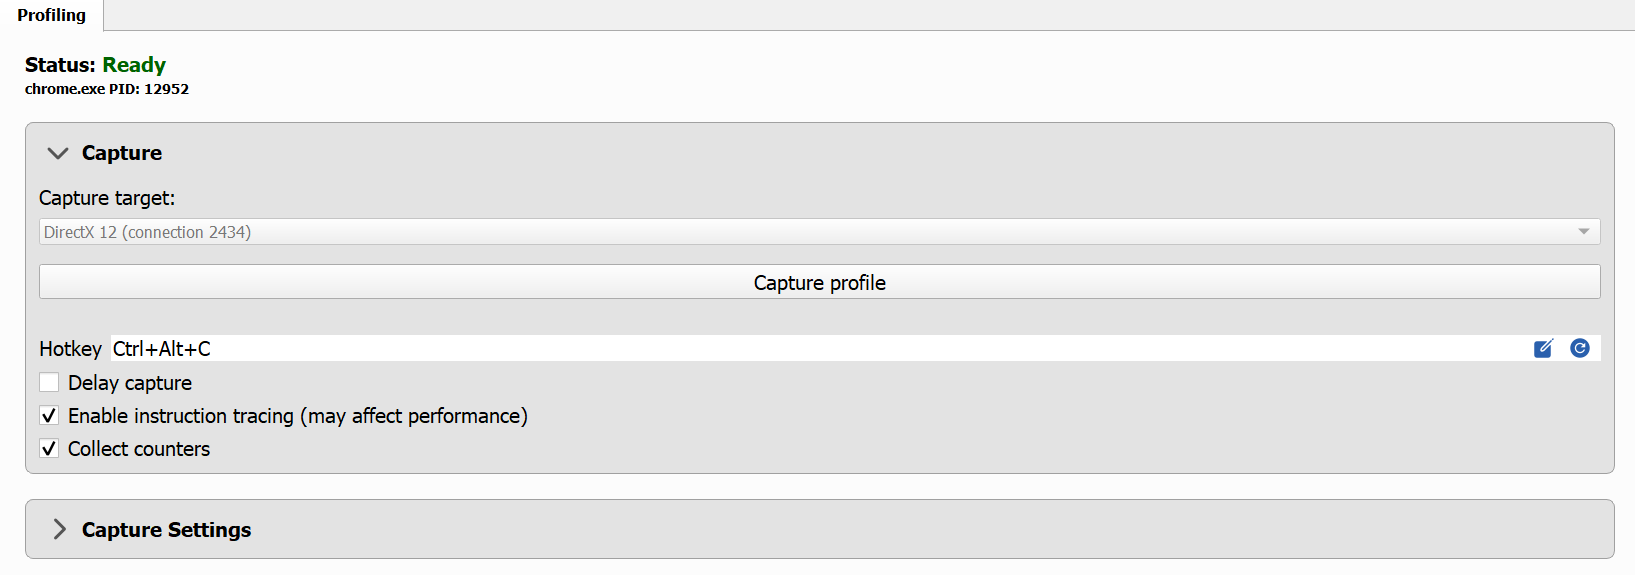
You can now hit the Capture profile button or use the configurable hot key Ctrl+Alt+C to capture your WebGPU app. The profile should appear on the right side of the app under Recently collected profiles.
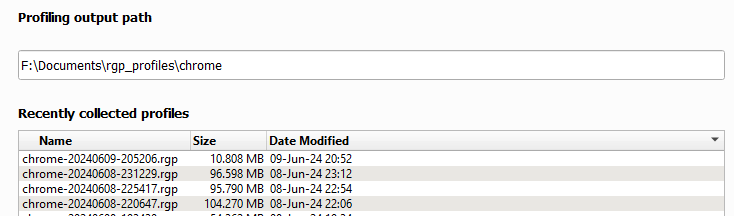
Simply double-click any of the files to open the Radeon GPU profiler. If that doesn’t work, you might need to configure that path manually by hitting the cog-wheel in the top right hand corner of your screen.
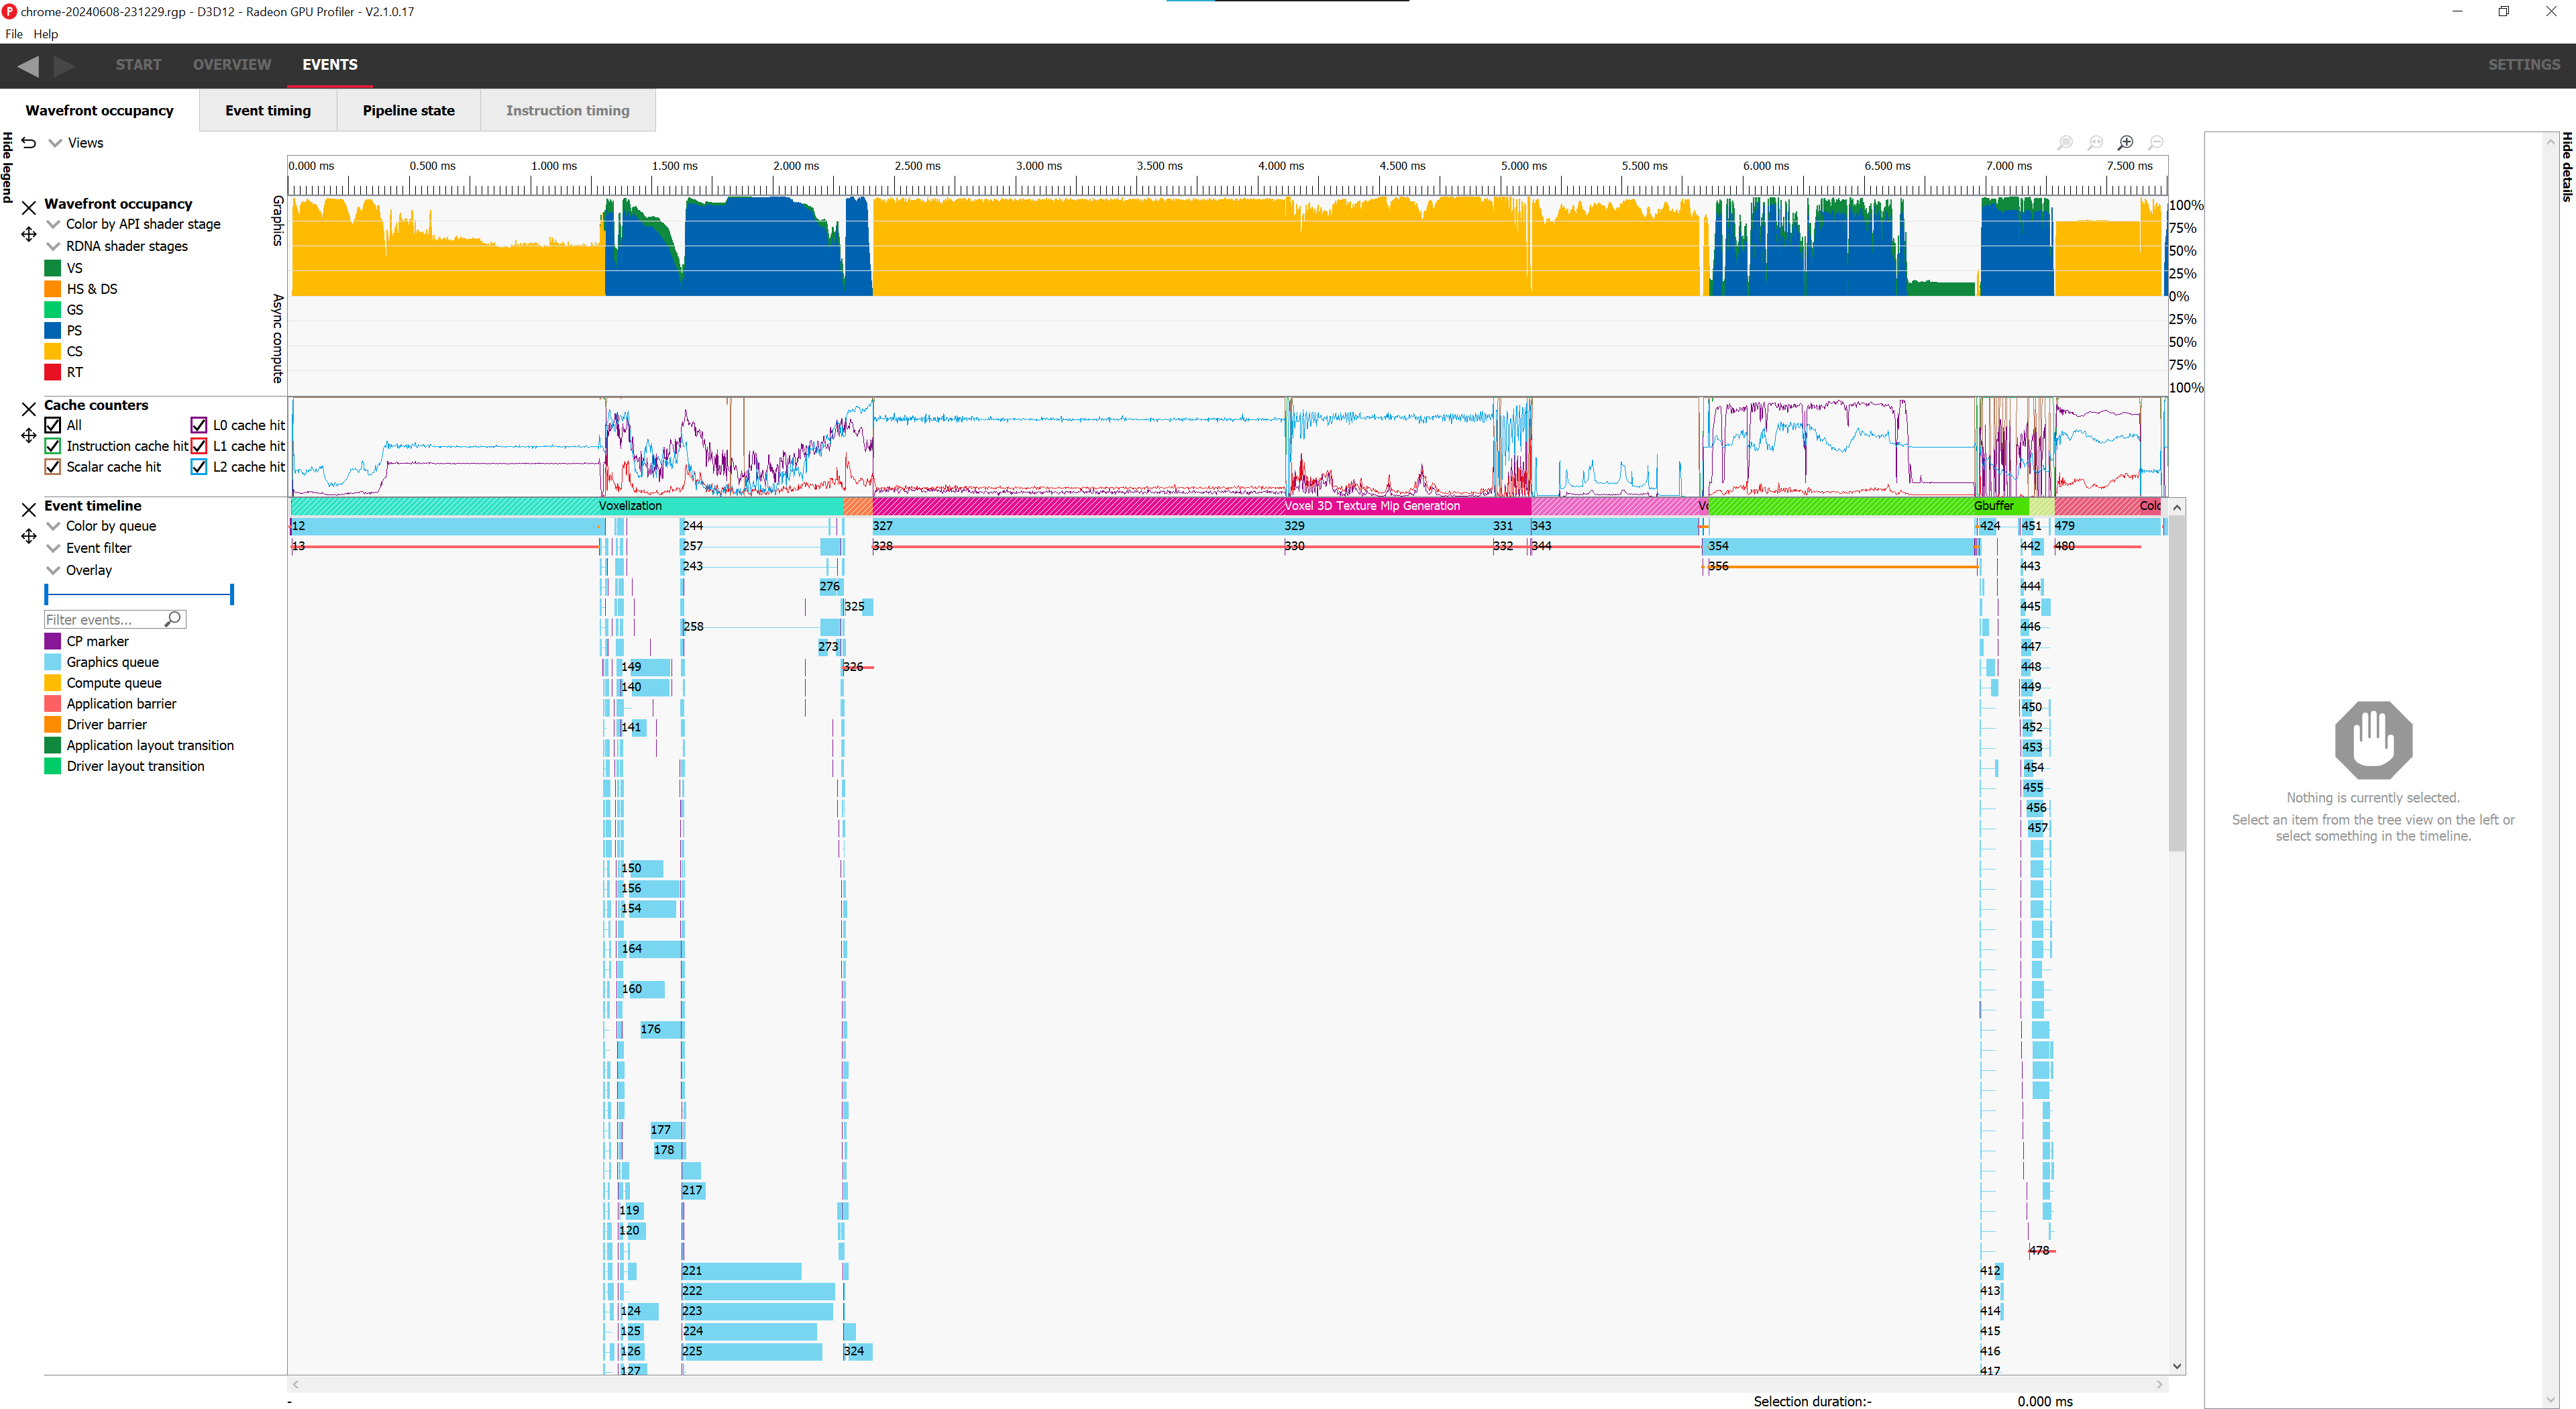
And voila, you are ready to explore the performance of your app using RGP. How to use RGP itself is outside the scope of this post but another one might follow ;). In the meantime, feel free to explore the following resources.
- RGP Documentation
- GDC 2024 - Game Optimization with the Radeon™ Developer Tool Suite (YT video)
- GDC 2024 - Game Optimization with the Radeon™ Developer Tool Suite (slides)
- Occupancy Explained (shameless plug)
Capturing a frame with Nsight
To profile with Nvidia hardware, first download and install Nsight Graphics. Much like PIX, Nsight must launch an app itself to be able to profile it. So open Nsight, click the connect button in the top left corner and select GPU Trace Profiler from the Activity tab.
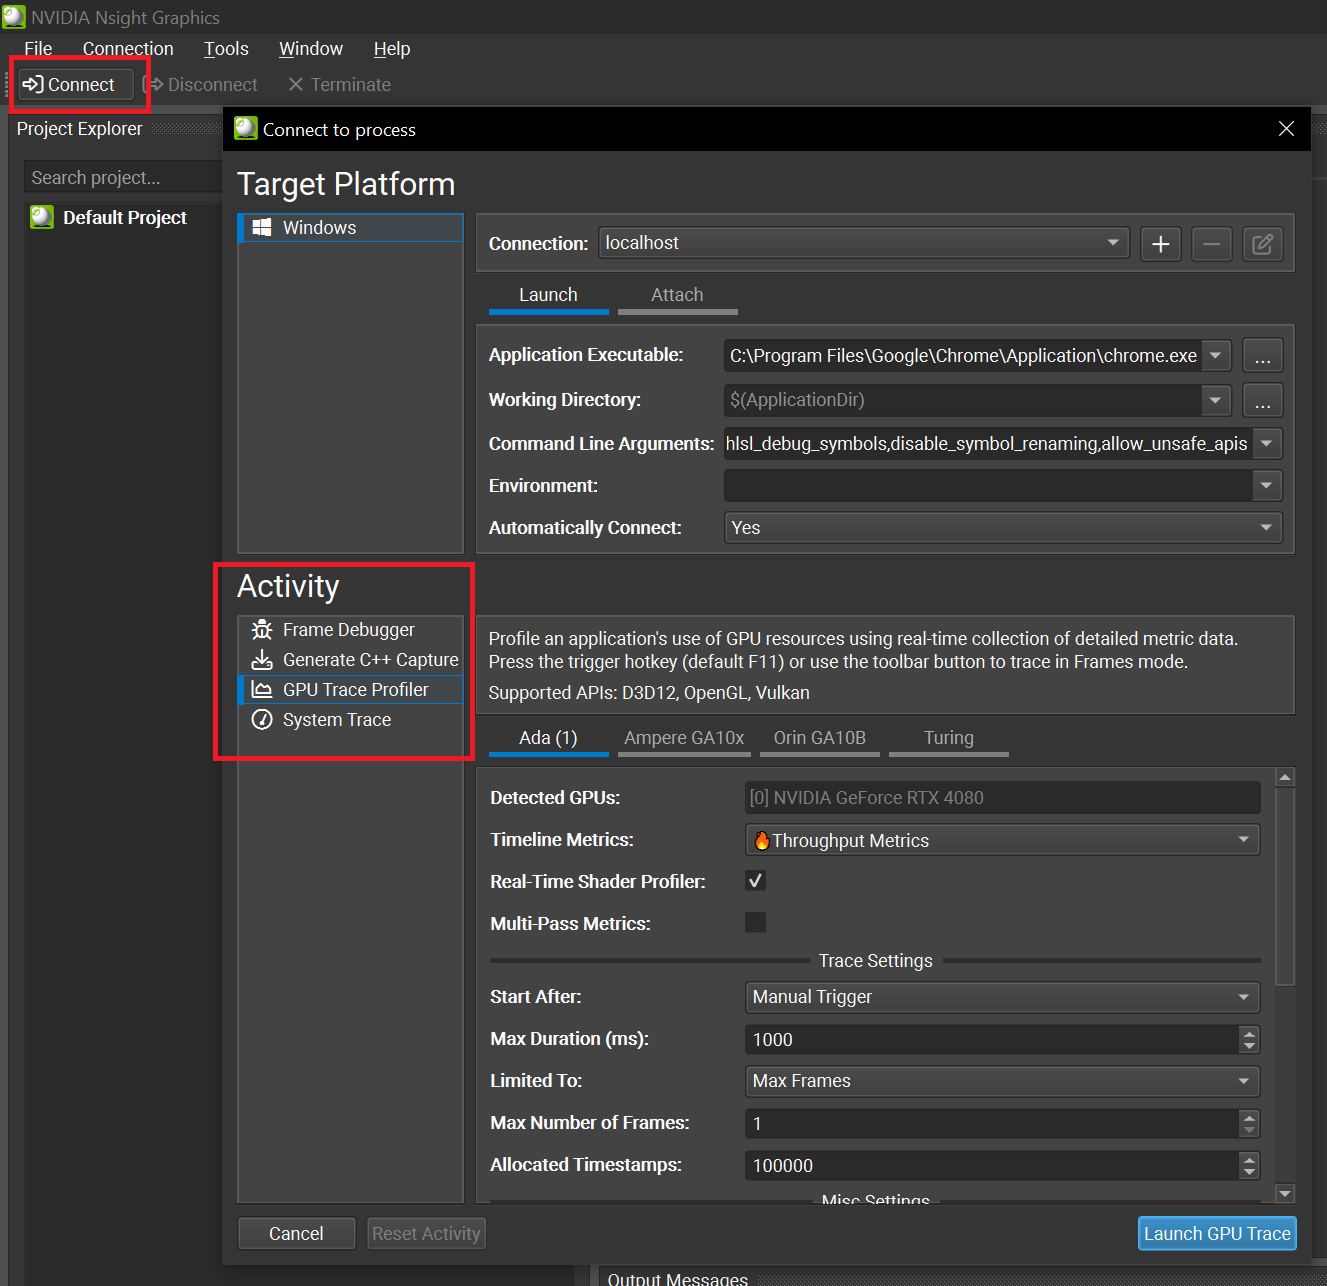
Select your Chrome executable in the Application Executable field, the path should look something like C:\Program Files\Google\Chrome\Application\chrome.exe. Don’t forget to fill the Command Line Arguments field with the relevant arguments, including the required --no-sandbox. The field should look something like --no-sandbox --disable-gpu-sandbox --disable-gpu-watchdog --disable-direct-composition --enable-dawn-features=emit_hlsl_debug_symbols,disable_symbol_renaming.
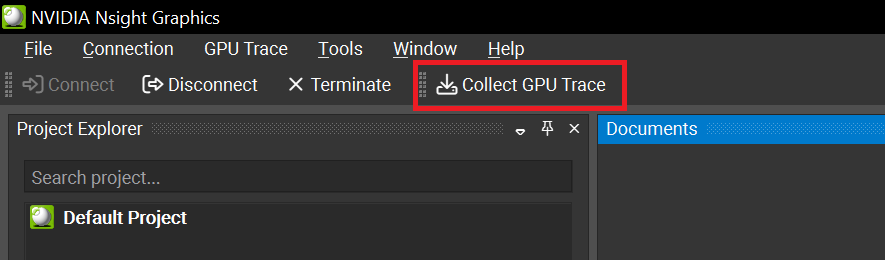
Once those fields are filled, just hit the Launch GPU Trace button in the bottom right corner and watch Chrome start. Open a tab with a WebGPU workload to make Nsight connect automatically. If the operation succeeded the app’s layout should change and a new Collect GPU Trace button should appear.
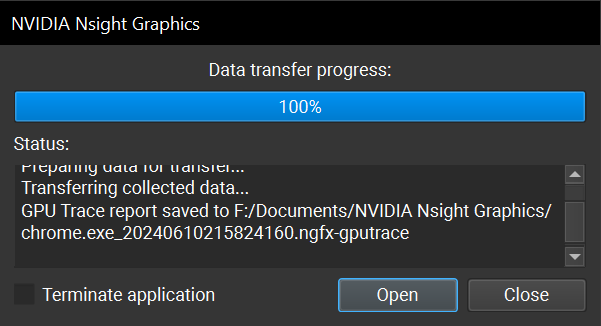
Once you’ve hit that button, a message box should inform you that the capture succeeded. Just press the Open button to access the capture.
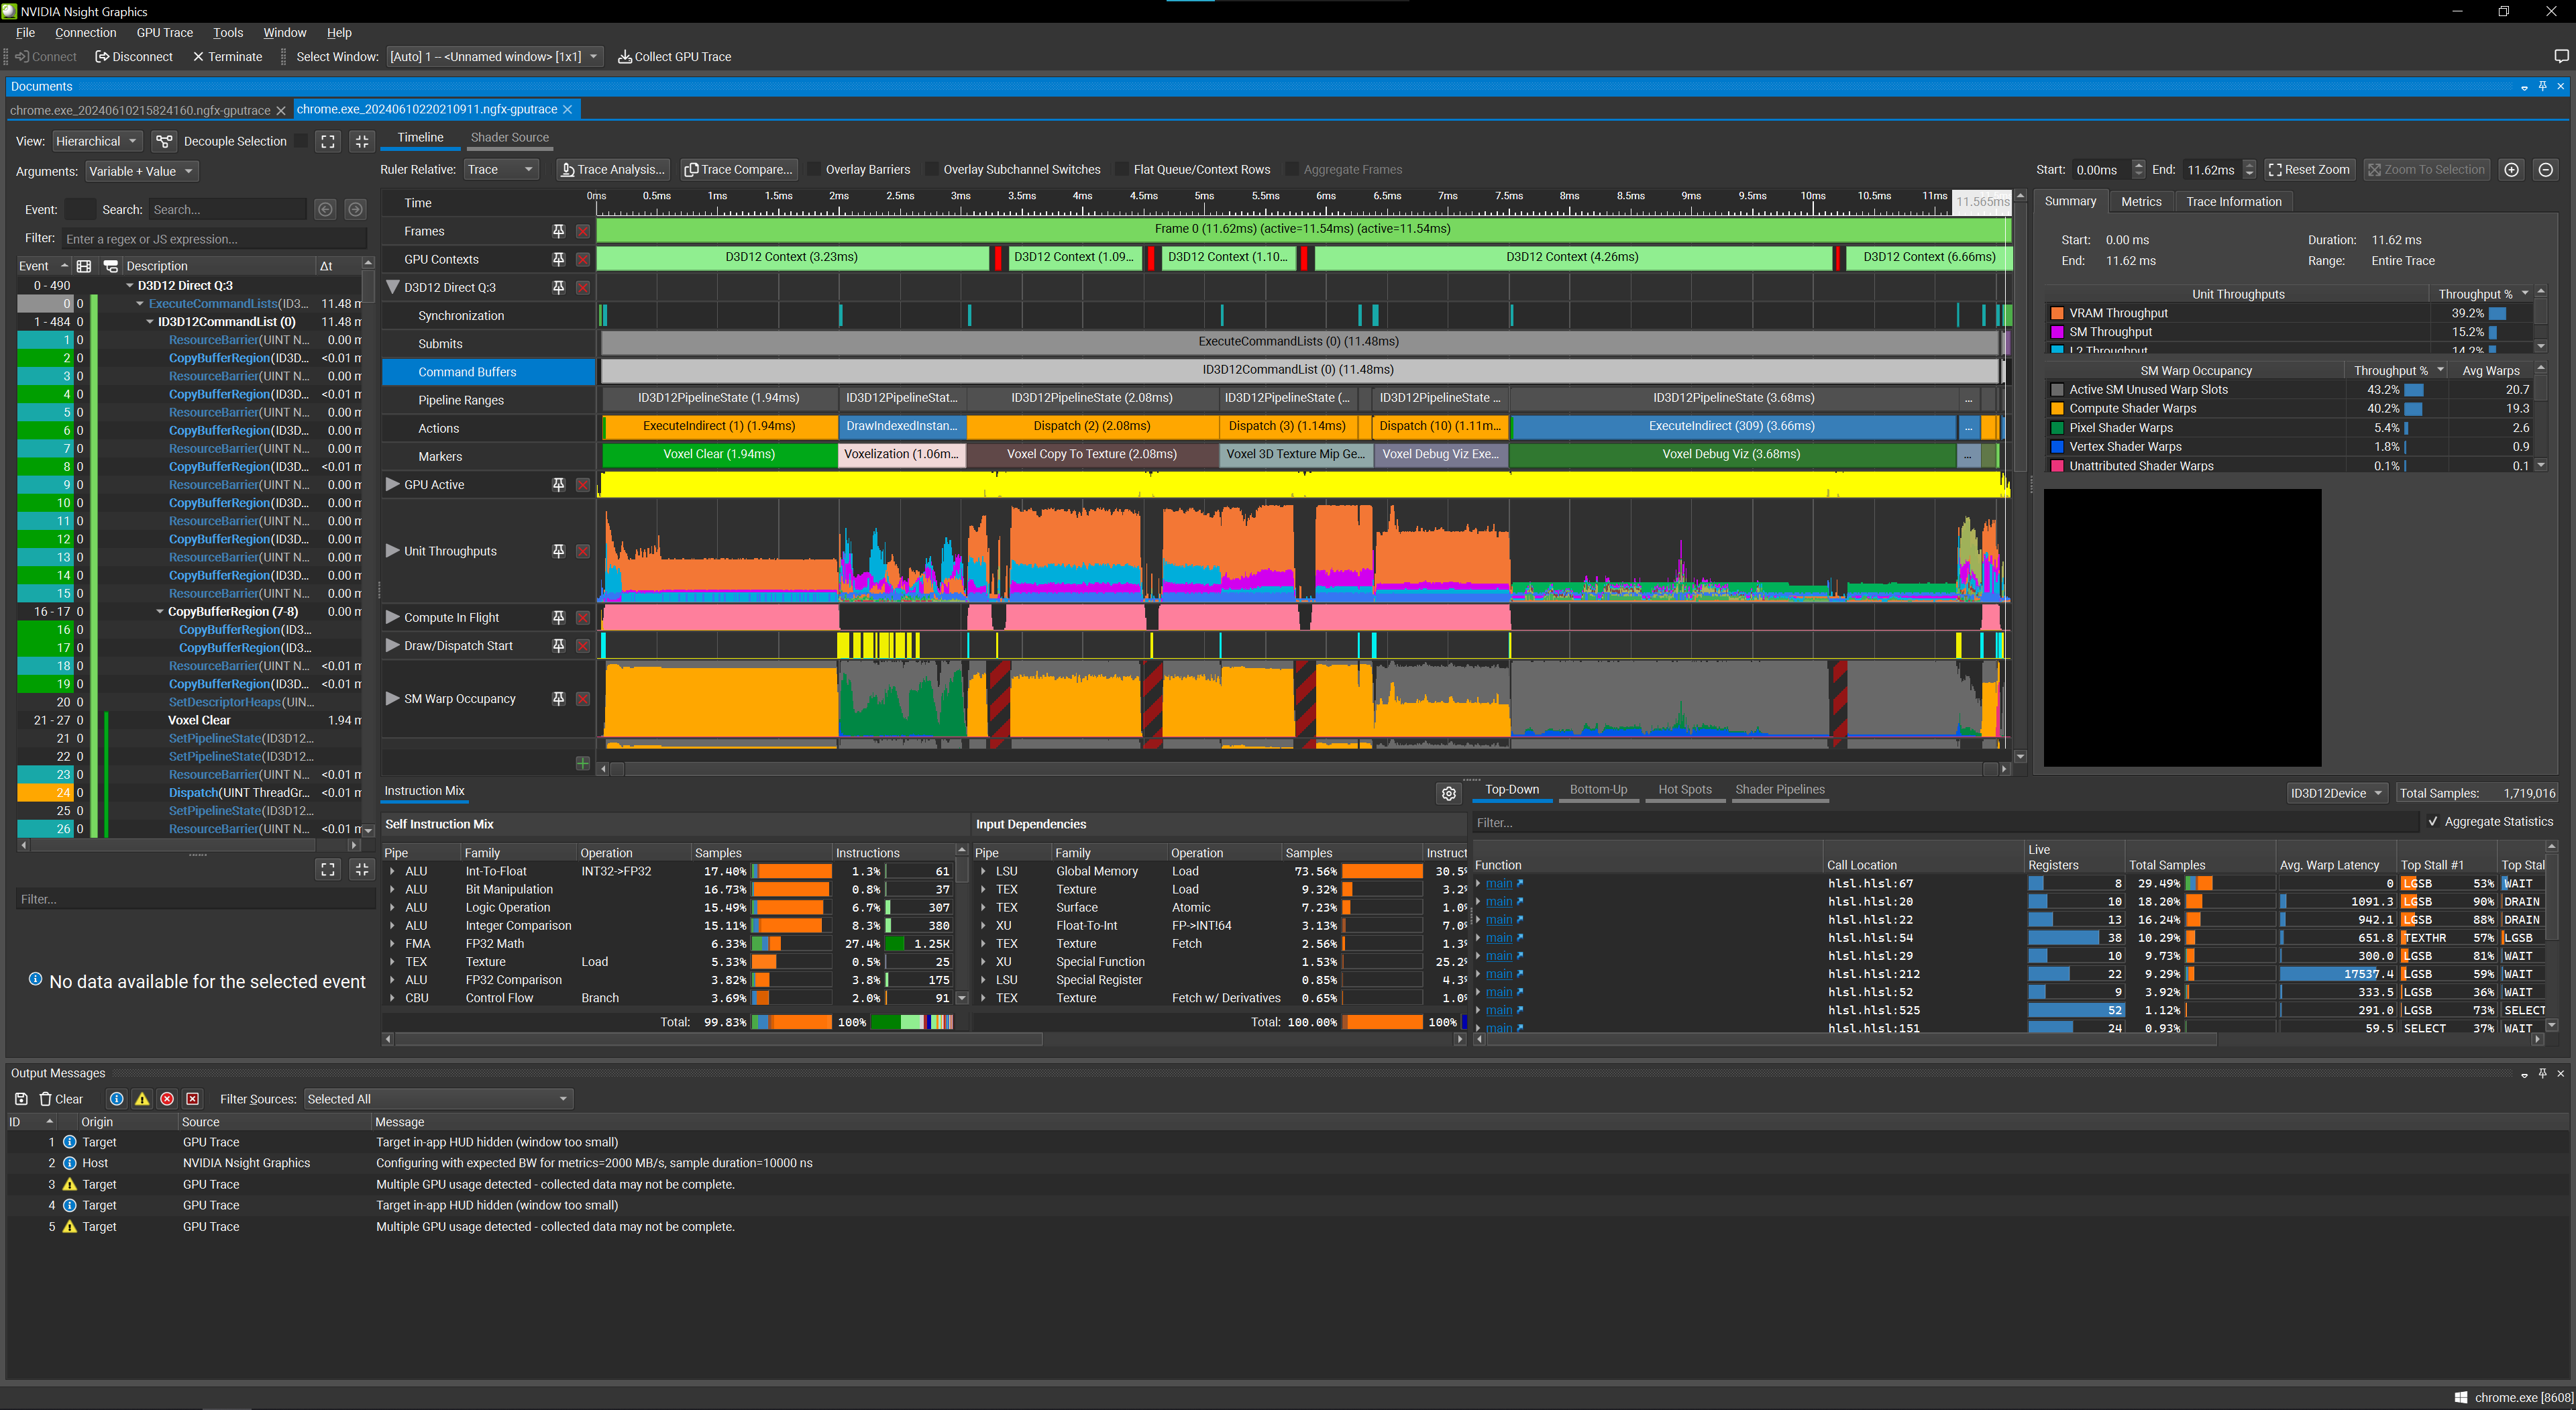
You should now see the following view and should be able to explore the performance of your app.
How to use Nsight itself is outside the scope of this post but feel free to explore the following resources.
- Nsight Documentation
- Powerful Shader Insights: Using Shader Debug Info with NVIDIA Nsight Graphics
- Identifying Shader Limiters with the Shader Profiler in NVIDIA Nsight Graphics
- Optimizing VK/VKR and DX12/DXR Applications Using Nsight Graphics: GPU Trace Advanced Mode Metrics
Closing Remarks
The solution provided here is a terrible hack that happens to trigger both RDP and Nsight at the time of writing this article. It’s entirely possible that this breaks tomorrow and there isn’t much I can do about it.
That being said, at this time it is also the only available option to properly profile the GPU for WebGPU on Windows / Chrome. This was my biggest pain point when working daily with WebGL, along with the lack of a proper graphics debugger. Now WebGPU has both through PIX and RGP/Nsight. To me that makes it a much more viable option for serious graphics programming. Performance doesn’t have to be about mythical knowledge and voodoo optimizing blindfolded with both hands tied in the back anymore. Fire up that profiler and look at some actual metrics!
TL;DR
⚠ Before anything else, please remember that this is a hacky solution and that you should not browse the open web with that DLL attached. It should only be used for a GPU profiling session and removed afterwards. It also conflicts with PIX, so you should remove it before attempting to take a capture. I would recommend adding that DLL to a specific flavor of Chrome ( Dev, Canary, etc. ) that you would only use for GPU profiling.
Instructions
- Download
d3d12.dllfrom the release section of this repository.- Place the DLL into the
\Google\Chrome\Applicationfolder.
- Place the DLL into the
- On AMD, download
WinPixEventRuntime.dllfrom the release section of that repository.- Place it into the
\Google\Chrome\Application\<Version Number>folder.
- Place it into the
- When launching Chrome, use the following command line arguments:
--no-sandbox --disable-gpu-sandbox --disable-gpu-watchdog --disable-direct-composition --enable-dawn-features=emit_hlsl_debug_symbols,disable_symbol_renaming
- Use your favorite GPU profiler as usual.